What do the numbers say about how host Finland, Canada, and the U.S. fared against one another at the 2019 Women's Worlds?
photo: Matt Zambonin / HHOF-IIHF Images
Historically, the final day at an elite IIHF women’s tournament is packed with tension from start to finish. And certainly, the 2019 IIHF Ice Hockey Women’s World Championship that ended on this day one year ago ramped up the drama to new heights.
In Espoo, we witnessed the U.S.’s fifth straight gold medal and unprecedented silver and bronze medals for Finland and Canada respectively.
Right now, of course, players, coaches, organizers, volunteers, media, and fans are unfortunately dealing with the disappointing news about the cancellation of the 2020 Women’s Worlds in Nova Scotia and many other competitions due to the ongoing coronavirus situation.
However, everyone is also looking forward to seeing the tournament come to Halifax and Truro in 2021, subject to the IIHF Congress’s approval.
So in the meantime, to spotlight the balance of power in international women’s hockey, we decided to take a closer, analytics-based look at the three key 2019 games between the medal-winners.
Those included the 3-2 U.S. win over Canada in the preliminary round (the lone meeting between the North American superpowers, which determined first place in Group A), the 4-2 Finnish win over Canada in the semi-finals (a first in Women’s Worlds history), and the 2-1 U.S. shootout win over Finland in the gold medal game.
And for this task, who better to call on than Stathletes co-founder Meghan Chayka?
Chayka, whose sports data company marks its 10th anniversary this year, was recently ranked 14th on Sportsnet’s list of the 25 most powerful women in hockey. Earlier this month, the Toronto-based innovator spoke at MIT’s annual Sloan Sports Analytics Conference, featuring diverse speakers ranging from FiveThirtyEight founder Nate Silver to NHL Seattle analyst Namita Nandakumar.
While Stathletes works heavily with NHL clubs and other men’s leagues worldwide, Chayka is a consistent advocate for women’s hockey. In collaboration with Stathletes analysts Domenic Galamani and Jeff Goeree, Chayka shed light for IIHF.com on what happened in those crucial moments in 2019.
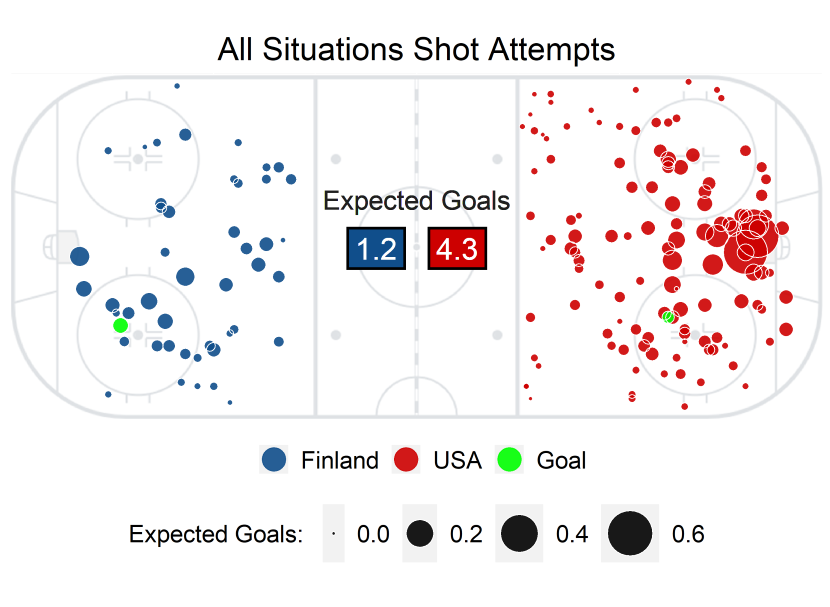
The Stathletes chart for all U.S. and Finnish shot attempts in the 2019 Women’s Worlds gold medal game.
First, how would you describe your overall methodology?
To measure shot danger, we applied our dynamic expected goals model to the women’s championship. The model is trained on NHL data and takes a number of variables into account, including shot distance, angle to the goal, shot type, goalie positioning, the preceding pass, rebounds, and more.
Bear in mind that women’s shots are qualitatively different than NHL shots in some or many cases, so the expected goal results may not be as accurate. Nevertheless, we feel that it is still a relatively good way to assess the relative danger of chances at the elite women’s IIHF level.
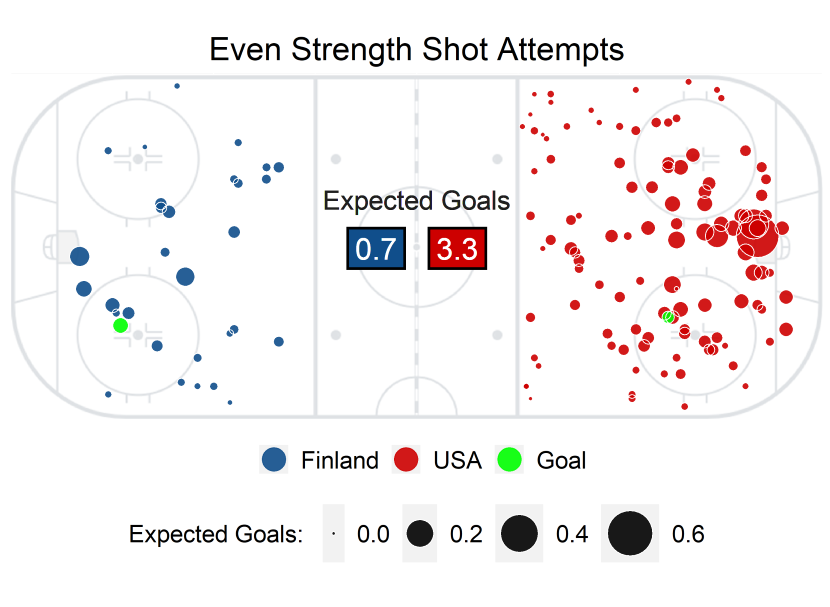
The Stathletes chart for U.S. and Finnish even-strength shot attempts in the 2019 Women’s Worlds gold medal game.
When you evaluated the U.S.’s gold medal victory over Finland, what did you find?
We have an expected score of 4.3 to 1.2 in favour of the Americans. The image above demonstrates how the U.S. managed to accumulate a significant number of chances in the slot at even strength.
It also tells us that in addition to generating more volume than the Finns, the U.S. generated higher-quality opportunities on average. There was an expected shooting percentage of 3.5 per cent for the U.S. vs. 2.5 per cent for Finland on all shot attempts. Clearly, Finnish goalie Noora Raty put forth a remarkable performance that helped fend off a relentless American onslaught.
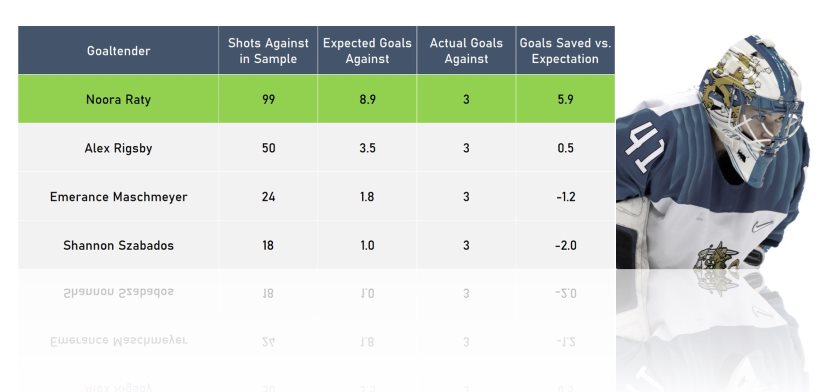
Stathletes data on Canadian, Finnish, and U.S. goalie performances in the three key games between the 2019 Women’s Worlds medal winners.
Raty was indeed named Best Goalie and a tournament all-star. How would you quantify her performance?
As you can see above, we compared Raty to other goaltenders in our dataset. The chances she faced typically generate about 9 goals at the NHL level – she only conceded three. She stands in a league of her own in the sample of tracked games at our disposal.
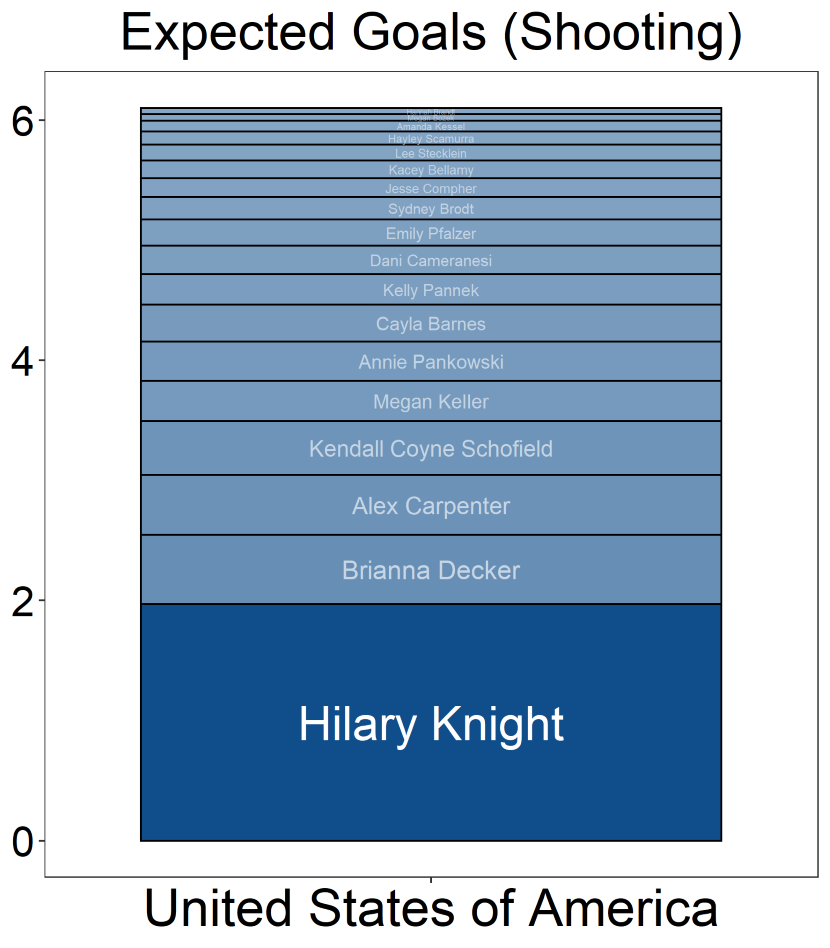
Stathletes data on U.S. shooters who generated the most opportunities in total versus Canada in the round-robin and Finland in the gold medal game in 2019.
The U.S.’s Hilary Knight led the tournament in scoring (7+4=11) for the fourth time. Does the data also show that she came through in the big games tracked here?
Well, speaking of outliers, Hilary Knight generated a significant proportion of the U.S.’s opportunities. She even dwarfed the likes of Kendall Coyne Schofield and Brianna Decker. Check out the image above to see individual expected goals contributed by each American skater.
Knight led the US with 1.97 expected goals in the two games tracked. Decker managed the second most with 0.58. Knight achieved her total by amassing 23 shot attempts. Two of them were within 10 feet and had just over a 50 percent probability of finding twine upon release, but failed to hit the net. One of them hit the iron with 12:49 left in overtime in the final.
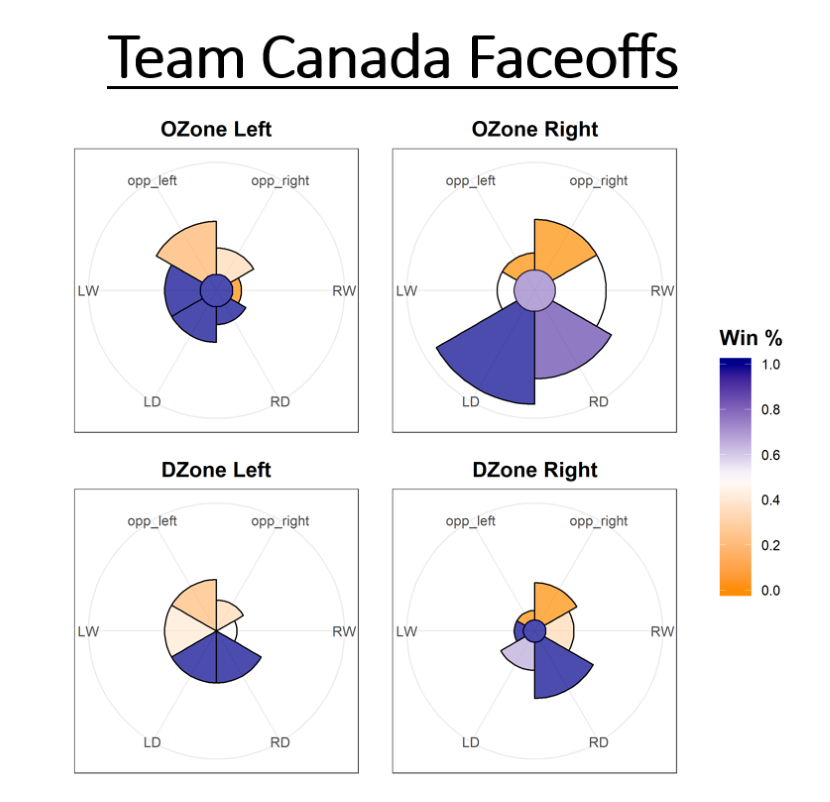
Stathletes data on Canada’s faceoff performance in its two key games against the U.S. (round-robin) and Finland (semi-final) at the 2019 Women’s Worlds.
The Canadians were, of course, disappointed to settle for the bronze medal for the first time. But if there was one aspect of the game where they clearly outshone the opposition, it was on faceoffs. For instance, in Canada’s 3-2 loss to the U.S., Brianne Jenner went 16-for-23 at the dot (69.57 percent) and Blayre Turnbull was 14-for-18 (77.78 percent). What other data did you glean?
This final series of images shows the results of Canadian, American, and Finnish faceoffs.
The shade of each direction reflects the win rate and the area represents the number of faceoffs in that direction. Canada won the majority of draws in the offensive zone right-circle and tended to direct them towards middle ice rather than the perimeter.
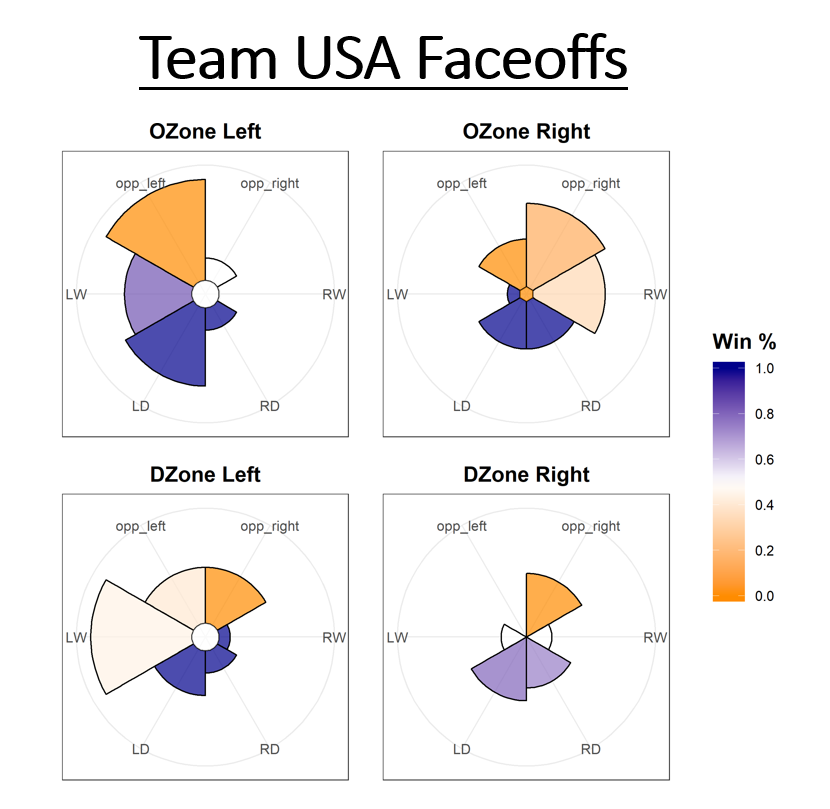
Stathletes data on the U.S.’s faceoff performance in its two key games against Canada (round-robin) and Finland (final) at the 2019 Women’s Worlds.
Another notable pattern concerns faceoffs that resulted in scrums (represented by the centre circle at each faceoff location). In these situations, the Canadians were incredibly dominant, potentially indicating exceptional support from their wingers.
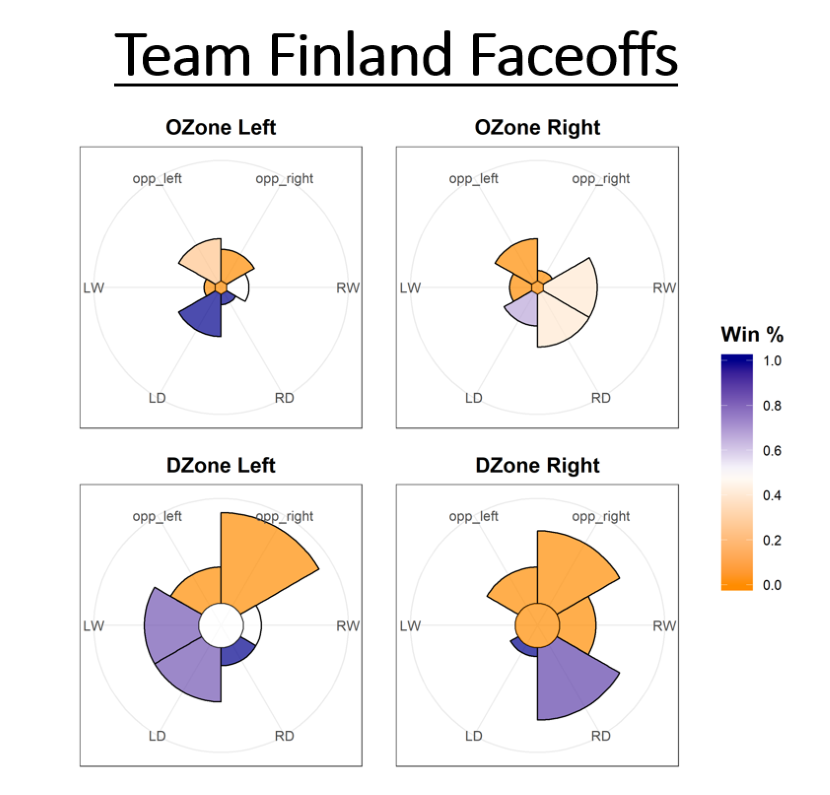
Stathletes data on Finland’s faceoff performance in its two key games against Canada (semi-final) and Finland (final) at the 2019 Women’s Worlds.
Many people wonder if Finland’s success last year truly represented a shift in the women’s hockey pecking order. At the same time, we can’t completely discount Finland’s lopsided round-robin losses to the U.S. (6-2) and Canada (6-1). You looked at those games too. Thoughts?
As to why the Finns were outplayed so badly, nothing honestly stood out to us in terms of style, be it passing, turnovers, puck recoveries, denials. They struggled with everything across the board.
Thanks to Stathletes for these insights. Note: Stathletes compiles its own data internally, and in some instances, statistics may differ from those officially compiled by the IIHF.
In Espoo, we witnessed the U.S.’s fifth straight gold medal and unprecedented silver and bronze medals for Finland and Canada respectively.
Right now, of course, players, coaches, organizers, volunteers, media, and fans are unfortunately dealing with the disappointing news about the cancellation of the 2020 Women’s Worlds in Nova Scotia and many other competitions due to the ongoing coronavirus situation.
However, everyone is also looking forward to seeing the tournament come to Halifax and Truro in 2021, subject to the IIHF Congress’s approval.
So in the meantime, to spotlight the balance of power in international women’s hockey, we decided to take a closer, analytics-based look at the three key 2019 games between the medal-winners.
Those included the 3-2 U.S. win over Canada in the preliminary round (the lone meeting between the North American superpowers, which determined first place in Group A), the 4-2 Finnish win over Canada in the semi-finals (a first in Women’s Worlds history), and the 2-1 U.S. shootout win over Finland in the gold medal game.
And for this task, who better to call on than Stathletes co-founder Meghan Chayka?
Chayka, whose sports data company marks its 10th anniversary this year, was recently ranked 14th on Sportsnet’s list of the 25 most powerful women in hockey. Earlier this month, the Toronto-based innovator spoke at MIT’s annual Sloan Sports Analytics Conference, featuring diverse speakers ranging from FiveThirtyEight founder Nate Silver to NHL Seattle analyst Namita Nandakumar.
While Stathletes works heavily with NHL clubs and other men’s leagues worldwide, Chayka is a consistent advocate for women’s hockey. In collaboration with Stathletes analysts Domenic Galamani and Jeff Goeree, Chayka shed light for IIHF.com on what happened in those crucial moments in 2019.
The Stathletes chart for all U.S. and Finnish shot attempts in the 2019 Women’s Worlds gold medal game.
First, how would you describe your overall methodology?
To measure shot danger, we applied our dynamic expected goals model to the women’s championship. The model is trained on NHL data and takes a number of variables into account, including shot distance, angle to the goal, shot type, goalie positioning, the preceding pass, rebounds, and more.
Bear in mind that women’s shots are qualitatively different than NHL shots in some or many cases, so the expected goal results may not be as accurate. Nevertheless, we feel that it is still a relatively good way to assess the relative danger of chances at the elite women’s IIHF level.
The Stathletes chart for U.S. and Finnish even-strength shot attempts in the 2019 Women’s Worlds gold medal game.
When you evaluated the U.S.’s gold medal victory over Finland, what did you find?
We have an expected score of 4.3 to 1.2 in favour of the Americans. The image above demonstrates how the U.S. managed to accumulate a significant number of chances in the slot at even strength.
It also tells us that in addition to generating more volume than the Finns, the U.S. generated higher-quality opportunities on average. There was an expected shooting percentage of 3.5 per cent for the U.S. vs. 2.5 per cent for Finland on all shot attempts. Clearly, Finnish goalie Noora Raty put forth a remarkable performance that helped fend off a relentless American onslaught.
Stathletes data on Canadian, Finnish, and U.S. goalie performances in the three key games between the 2019 Women’s Worlds medal winners.
Raty was indeed named Best Goalie and a tournament all-star. How would you quantify her performance?
As you can see above, we compared Raty to other goaltenders in our dataset. The chances she faced typically generate about 9 goals at the NHL level – she only conceded three. She stands in a league of her own in the sample of tracked games at our disposal.
Stathletes data on U.S. shooters who generated the most opportunities in total versus Canada in the round-robin and Finland in the gold medal game in 2019.
The U.S.’s Hilary Knight led the tournament in scoring (7+4=11) for the fourth time. Does the data also show that she came through in the big games tracked here?
Well, speaking of outliers, Hilary Knight generated a significant proportion of the U.S.’s opportunities. She even dwarfed the likes of Kendall Coyne Schofield and Brianna Decker. Check out the image above to see individual expected goals contributed by each American skater.
Knight led the US with 1.97 expected goals in the two games tracked. Decker managed the second most with 0.58. Knight achieved her total by amassing 23 shot attempts. Two of them were within 10 feet and had just over a 50 percent probability of finding twine upon release, but failed to hit the net. One of them hit the iron with 12:49 left in overtime in the final.
Stathletes data on Canada’s faceoff performance in its two key games against the U.S. (round-robin) and Finland (semi-final) at the 2019 Women’s Worlds.
The Canadians were, of course, disappointed to settle for the bronze medal for the first time. But if there was one aspect of the game where they clearly outshone the opposition, it was on faceoffs. For instance, in Canada’s 3-2 loss to the U.S., Brianne Jenner went 16-for-23 at the dot (69.57 percent) and Blayre Turnbull was 14-for-18 (77.78 percent). What other data did you glean?
This final series of images shows the results of Canadian, American, and Finnish faceoffs.
The shade of each direction reflects the win rate and the area represents the number of faceoffs in that direction. Canada won the majority of draws in the offensive zone right-circle and tended to direct them towards middle ice rather than the perimeter.
Stathletes data on the U.S.’s faceoff performance in its two key games against Canada (round-robin) and Finland (final) at the 2019 Women’s Worlds.
Another notable pattern concerns faceoffs that resulted in scrums (represented by the centre circle at each faceoff location). In these situations, the Canadians were incredibly dominant, potentially indicating exceptional support from their wingers.
Stathletes data on Finland’s faceoff performance in its two key games against Canada (semi-final) and Finland (final) at the 2019 Women’s Worlds.
Many people wonder if Finland’s success last year truly represented a shift in the women’s hockey pecking order. At the same time, we can’t completely discount Finland’s lopsided round-robin losses to the U.S. (6-2) and Canada (6-1). You looked at those games too. Thoughts?
As to why the Finns were outplayed so badly, nothing honestly stood out to us in terms of style, be it passing, turnovers, puck recoveries, denials. They struggled with everything across the board.
Thanks to Stathletes for these insights. Note: Stathletes compiles its own data internally, and in some instances, statistics may differ from those officially compiled by the IIHF.